5 Indian states beat World Bank's upper-middle income benchmark
Latest per capita income estimates in US dollar terms show five Indian states have crossed the World Bank's upper-middle-income threshold. Three other states came close, underscoring uneven income levels across India.
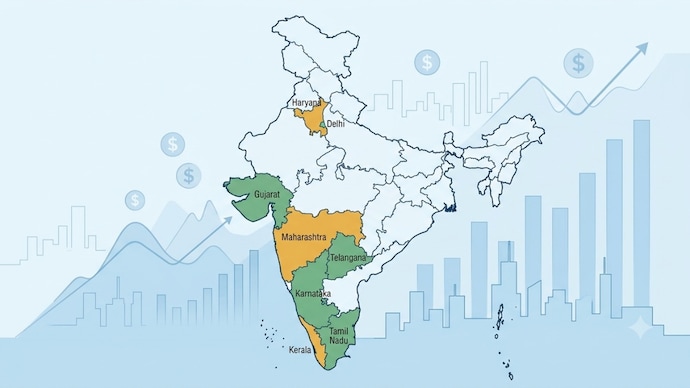
India's economic growth story is reflected differently across its states. While some have reached income levels comparable to the World's Bank's upper-middle-income economies, others continue to lag behind. According to the latest per capita income estimates in US dollar terms, five Indian states have crossed the World Bank's upper-middle-income threshold of $4,635, while three others narrowly missed qualifying.
Here's a closer look at the numbers.
STATES THAT HAVE CROSSED THE UPPER-MIDDLE-INCOME THRESHOLD
| Rank | State | Per Capita Income (US$) | Status |
|---|---|---|---|
| 1 | Delhi | 6,217 | Above threshold |
| 2 | Karnataka | 5,579 | Above threshold |
| 3 | Telangana | 5,407 | Above threshold |
| 4 | Tamil Nadu | 5,329 | Above threshold |
| 5 | Gujarat | 4,734 | Above threshold |
Delhi tops the list with a per capita income of $6,217, followed by Karnataka, Telangana, Tamil Nadu and Gujarat. These states have benefited from strong growth in sectors such as information technology, manufacturing, financial services, trade and industrial development.
THREE STATES THAT NARROWLY MISSED THE CUT
| State | Per Capita Income (US$) | Difference from Threshold |
|---|---|---|
| Maharashtra | 4,628 | Missed by $8 |
| Haryana | 4,627 | Missed by $9 |
| Kerala | 4,610 | Missed by $26 |
The gap is extremely small, suggesting that even modest economic growth could push these states into the upper-middle-income category in the near future.
STATES WITH THE LOWEST PER CAPITA INCOME
| State | Per Capita Income (US$) |
|---|---|
| Bihar | 984 |
| Uttar Pradesh | 1,403 |
| Jharkhand | 1,470 |
These figures highlight the economic disparities that continue to exist across India. Lower income levels are often linked to slower industrialisation, fewer employment opportunities and lower productivity.
WORLD BANK INCOME CLASSIFICATION
| Category | Per Capita Income (US$) |
|---|---|
| Low Income | Below $1,175 |
| Lower-Middle Income | $1,175–$4,635 |
| Upper-Middle Income | $4,635–$14,375 |
| High Income | Above $14,375 |
The World Bank updates these thresholds every year to classify economies based on Gross National Income (GNI) per capita.
WHAT THE NUMBERS INDICATE
The latest figures show that several Indian states are steadily climbing the income ladder, driven by expanding industries, services and investments. At the same time, the large gap between the highest- and lowest-income states underscores the need for balanced regional development, stronger infrastructure, better education and more employment opportunities.
As more states inch closer to the upper-middle-income threshold, India's economic progress will increasingly depend on ensuring that growth is both sustained and inclusive.
India's economic growth story is reflected differently across its states. While some have reached income levels comparable to the World's Bank's upper-middle-income economies, others continue to lag behind. According to the latest per capita income estimates in US dollar terms, five Indian states have crossed the World Bank's upper-middle-income threshold of $4,635, while three others narrowly missed qualifying.
Here's a closer look at the numbers.
STATES THAT HAVE CROSSED THE UPPER-MIDDLE-INCOME THRESHOLD
| Rank | State | Per Capita Income (US$) | Status |
|---|---|---|---|
| 1 | Delhi | 6,217 | Above threshold |
| 2 | Karnataka | 5,579 | Above threshold |
| 3 | Telangana | 5,407 | Above threshold |
| 4 | Tamil Nadu | 5,329 | Above threshold |
| 5 | Gujarat | 4,734 | Above threshold |
Delhi tops the list with a per capita income of $6,217, followed by Karnataka, Telangana, Tamil Nadu and Gujarat. These states have benefited from strong growth in sectors such as information technology, manufacturing, financial services, trade and industrial development.
THREE STATES THAT NARROWLY MISSED THE CUT
| State | Per Capita Income (US$) | Difference from Threshold |
|---|---|---|
| Maharashtra | 4,628 | Missed by $8 |
| Haryana | 4,627 | Missed by $9 |
| Kerala | 4,610 | Missed by $26 |
The gap is extremely small, suggesting that even modest economic growth could push these states into the upper-middle-income category in the near future.
STATES WITH THE LOWEST PER CAPITA INCOME
| State | Per Capita Income (US$) |
|---|---|
| Bihar | 984 |
| Uttar Pradesh | 1,403 |
| Jharkhand | 1,470 |
These figures highlight the economic disparities that continue to exist across India. Lower income levels are often linked to slower industrialisation, fewer employment opportunities and lower productivity.
WORLD BANK INCOME CLASSIFICATION
| Category | Per Capita Income (US$) |
|---|---|
| Low Income | Below $1,175 |
| Lower-Middle Income | $1,175–$4,635 |
| Upper-Middle Income | $4,635–$14,375 |
| High Income | Above $14,375 |
The World Bank updates these thresholds every year to classify economies based on Gross National Income (GNI) per capita.
WHAT THE NUMBERS INDICATE
The latest figures show that several Indian states are steadily climbing the income ladder, driven by expanding industries, services and investments. At the same time, the large gap between the highest- and lowest-income states underscores the need for balanced regional development, stronger infrastructure, better education and more employment opportunities.
As more states inch closer to the upper-middle-income threshold, India's economic progress will increasingly depend on ensuring that growth is both sustained and inclusive.

